Overview
The SMC (Smart Money Concepts) indicator is a specialized analysis tool for traders, designed to view the market from the perspective of institutional movements. With its help, you can decipher market structure, identify bullish and bearish blocks, and much more.
Features of the SMC Indicator
- Market Structure
- Order Blocks with Volume Metrics
- IMBALANCE
- Premium and Discount Zones
- Previous Highs and Lows Feature
- Bullish/Bearish Dashboard
- Volume Profile (Fixed)

1. Market Structure
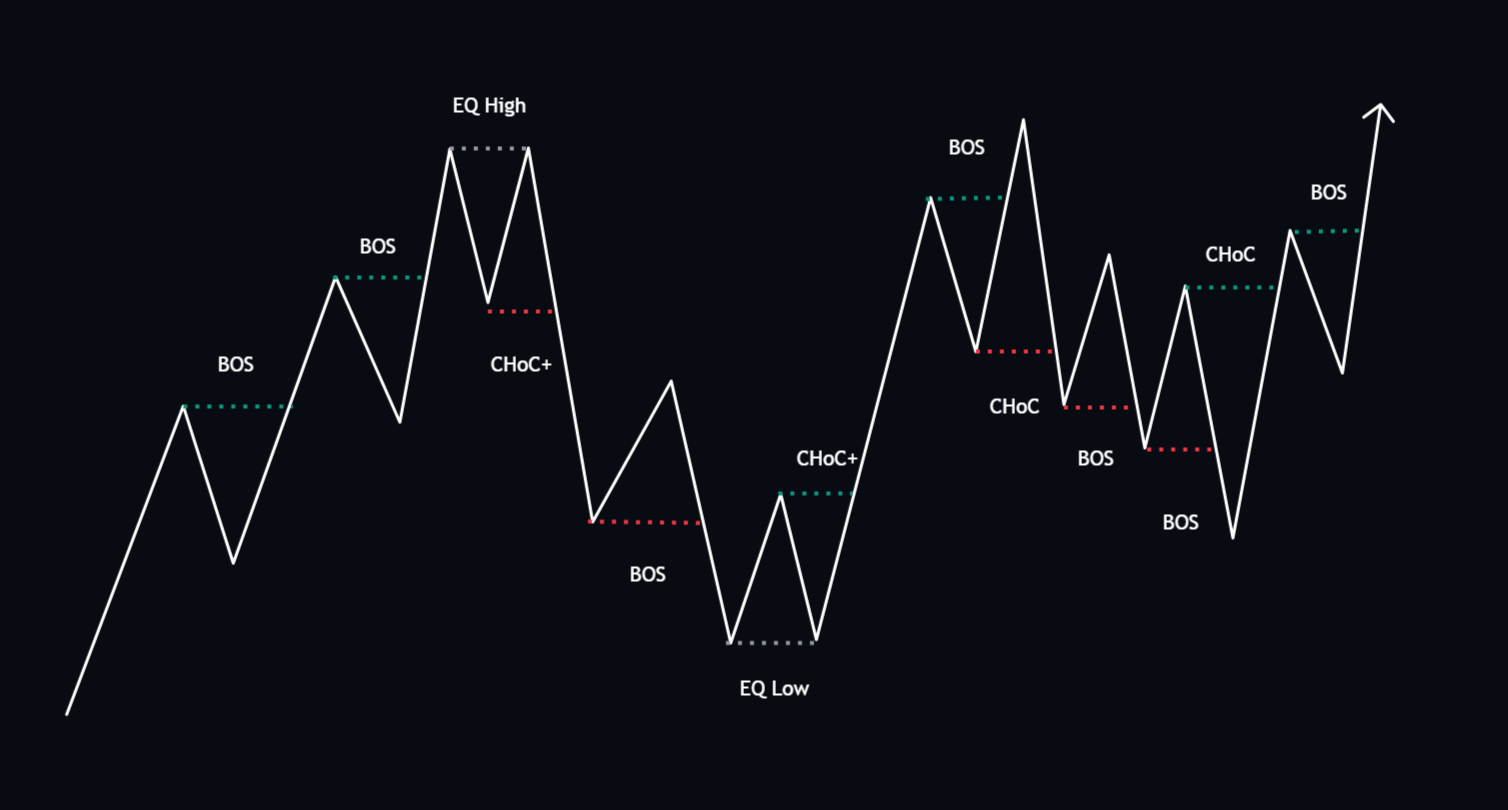
BOS (Break of Structure): A BOS is a “break of structure” in the chart, signaling a significant change in market behavior, such as breaking through a support or resistance line.
CHoCH (Change of Character): CHoCH stands for “change of character” and refers to a significant change in the behavior or structure of the market, often recognizable by a trend reversal or weakness.
Equalized High/Low (EH/L): A chart pattern showing two consecutive low or high points, often signaling an impending trend reversal.
In the image, we see a demonstration of market structure labeling within this indicator. The automatic BOS & CHoCH labels above the dotted lines provide clear indications of breakouts and reversals within the internal market structure (short-term price movements). The “CHoCH+” label is also shown; it is triggered only when the price has already reached a new higher low or lower high.

2. Order Blocks with Volume Metrics
Order Block:
A price range on the chart where significant buy or sell orders were placed.
Volume Metric in Order Block:
The trading volume within a specific order block, used to assess the strength or weakness of a particular support or resistance area.
As demonstrated in the image, monitoring these volume metrics can be crucial to identify price ranges where the price moves in a certain direction with high volume or reverses.

3. Imbalance
Imbalance:
Ist ein Zustand im Markt, in dem ein deutliches Ungleichgewicht zwischen Käufern und Verkäufern besteht. Diese Bereiche sind oft Indikatoren für starke Preisbewegungen in die Richtung des Ungleichgewichts.
Wie im Bild gezeigt, zeigt unser Indikator Imbalance-Bereiche, um Ungleichgewichte im Markt zu identifizieren. Diese werden oft vom Preis gefüllt, bevor der bestehende Trend fortgesetzt wird.

4. Premium and Discount Zones
This feature highlights areas where the price is considered overvalued (Premium) or undervalued (Discount).
Application of Premium and Discount Zones:
As shown in the image, Premium and Discount zones can serve as indicators of overbought or oversold market conditions. Overbought zones could be interpreted as potential selling points and oversold zones as potential buying points.

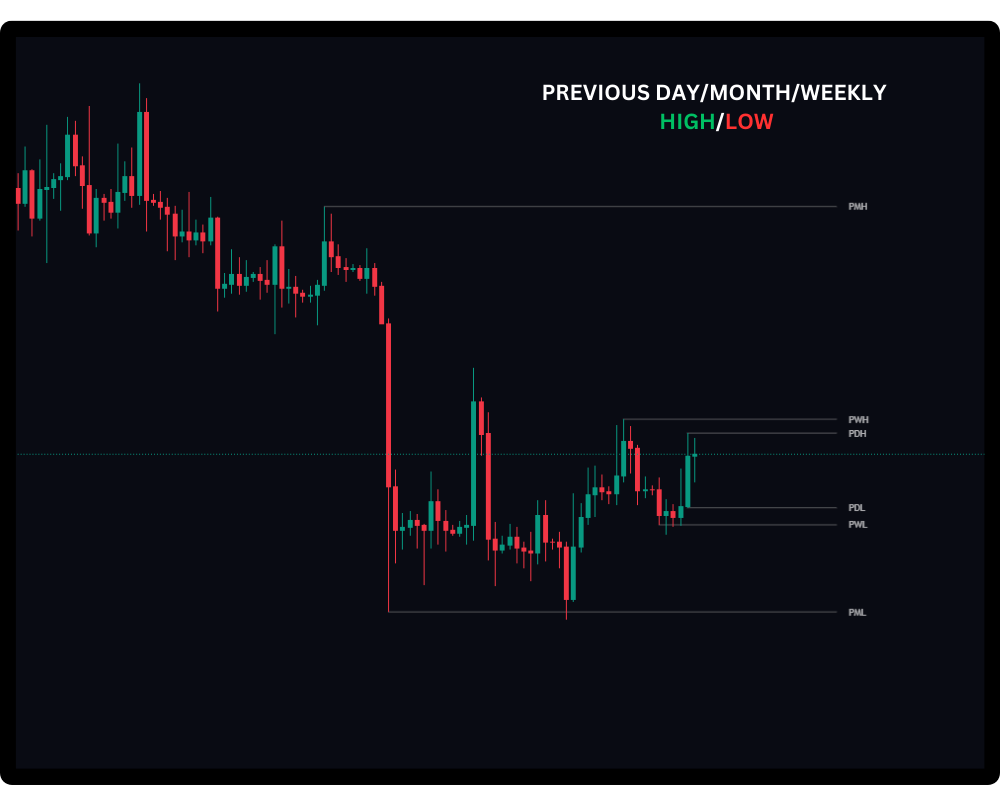
5. Previous Highs and Lows Feature
This feature displays the highs and lows in respective time units (daily, weekly, and monthly basis) directly on the chart.

6. Bullish/Bearish Dashboard
The dashboard is located at the bottom left of the chart and displays the current market condition in four different time frames: 15 minutes, 1 hour, 4 hours, and 1 day. Based on the market structure in these time frames, it indicates whether the market is bullish or bearish.

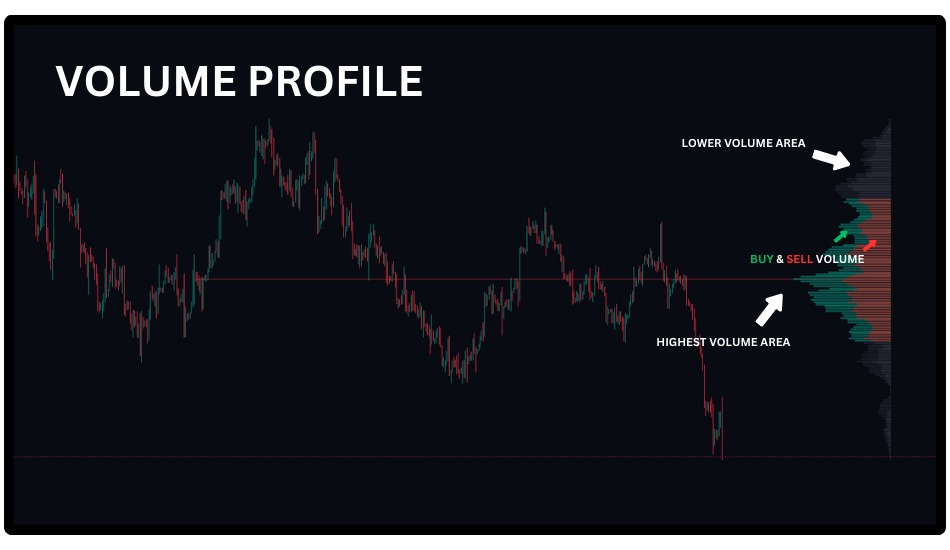
7. Volume Profile (Fixed)
This feature displays the price-wise trading volume in various price ranges to identify areas of high and low liquidity. The volume profile is positioned on the right side of the chart. It also includes a high-volume point, highlighted by a red line. The profile additionally shows precisely where and to what extent buying and selling have occurred.
